
Looking at the distribution of ratings on Goodreads
27 February 2022 ·Goodreads is a popular site for tracking books you have read and finding new ones using your ratings. Many people have noticed that Goodreads ratings have a surprisingly small variance: it seems like most popular books have ratings around ~3.8. This suggests that a book the community assesses as fairly poor and one that it says is great will be closer in rating than the descriminatory capacity of a single user (you can’t grant half-stars in your Goodreads ratings)!
Is the situation really as bad as all that? Can anything be done about it?
One user scraped Goodreads’ API fairly recently and made the data publicly available. I downloaded this data and performed some analysis on the distribution of ratings on the site.
One thing I found right away is that “only” about half of the films in the dataset have ratings between 3 and 4. There’s a bigger issue, though: about 10% of the films have a rating of precisely 4. That’s because this includes a ton of films with only a few ratings, and 4 is the most common rating on the site. What we need is a model.
What we’d like to have is a distribution function describing our knowledge about the dataset. This is usually called a Bayesian prior. Let’s consider a simplified example.
Bayesian update
If the data were in the form of thumb-ups and thumb-downs, our data would
consist of a proportion of thumb-ups out of the total number of ratings. In
other words, it would be
binomial data. This
entails that our prior distribution would be the corresponding
conjugate prior, the Beta
distribution. If we fit a Beta distribution to the data, we would get a
function with two parameters, α and β.
These parameters have a deeper meaning. Bayesian update allows you to
introduce new information to the prior knowledge you have, and tells you
what your resulting beliefs about the question at hand should be. When your
prior is a Beta distribution, the parameters are simply added to the new
evidence. If you have a new book with x thumb-ups and y thumb-downs,
the prior evidence suggests that the book’s true proportion of thumb-ups to
thumb-downs is x+α : y+β. Because the resulting rating is adjusted by
adding these “fake” ratings, α and β are sometimes called
pseudocounts.
Alternatively, with a simple substitution, you can think of yourself as
adding c = α + β fake ratings with the average value m = α / (α+β).
This approach is given the name “bayesian average” by
Paul Masurel, here.
We don’t have just two possibilities, of course, we have five: five different star ratings. A distribution with several options seems like it would be appropriately characterized by the generalization of the beta distribution known as the Dirichlet. This approach is what Masurel suggests:
If you have the relevant data and infinite time, you may set these two values by fitting a Dirichlet distribution on the dataset of the ratings of all your computer books. However it is very common to just choose a pair of parameter that mimick the behavior that we are looking for.
I’ve seen this approcah recommended by several others as well. Okay, I have the relevant data and infinite time, but let’s consider whether fitting a Dirichlet really makes sense here. I believe that it actually does not!
The problem is that the Dirichlet (and actually, the beta distribution) are conjugate priors for distributions of categorial variables, not discrete ones. The binomial distribution, for instance, has success and failure conditions, not 0 and 1. The multinomial distribution that has any number of distinct categories.
Why is this an issue? Well, suppose we had distinct categories. Users could describe their reaction to a book as “green”, “orange”, “red”, “yellow”, or “blue”. (Assume that users wouldn’t immediately derive a mutually agreed upon ranking system for these colors, i.e. they really are just colors.) In that case, there would be no inherent correlation between colors, and you couldn’t average them into an overall color. Star ratings are precisely the opposite. They’re numerical ratings giving a quality score, and usually what we care about is just the average.
If you fit a Dirichlet distribution to star ratings, the resulting distribution will be underconfident about the behavior of the average star rating, because it treats the ratings not as comparable numbers but as incomparable categories. More specifically, a set of star ratings will converge to their individual true values as new ratings come in more slowly than their average will converge to its true value.
As proof of this, here is the result I get when fitting the Dirichlet distribution to the Goodreads data.1 I am plotting the Dirichlet reparameterized to show the strength of the prior on the average value.
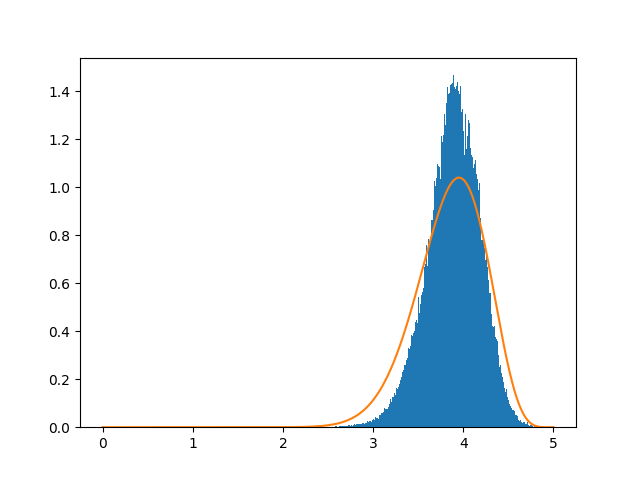
As you can clearly see, the result is underconfident. Don’t use the Dirichlet as a prior for star ratings, especially when you only care about the average!
What should you use instead? I think the beta distribution is actually more reasonable here. Instead of modeling the proportion of successes and failures in a series of Bernoulli trials, we can think of it as modeling the average value of a series of individual equally weighted fractional successes, where e.g. 5 stars means perfect success and 1 means complete failure.
If anyone knows of a better way of motivating the use of a particular distribution here, please do contact me by email or on Github and let me know.
The results
I filtered out books with fewer than 50 ratings, to eliminate books for which no rating consensus has yet been formed. (I also implemented some special handling for books that have at least one star rating which no one has yet given them, though this is a technical detail which I’ll let the interested read the code to see.)
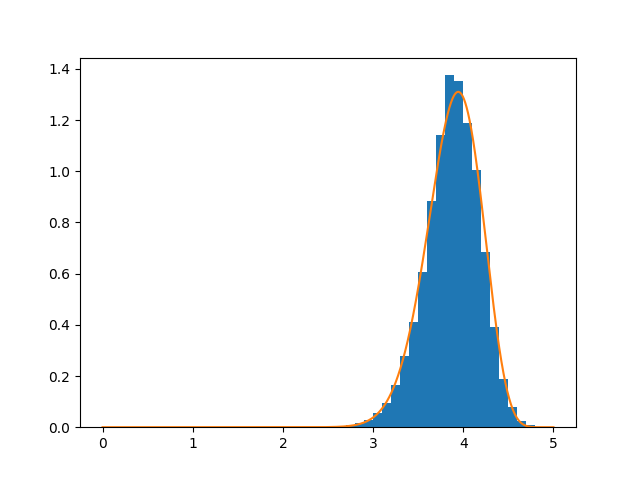
The beta distribution appears to be a very good fit for the data. Experimentally, the distribution of dirichlet averages seems to become more and more beta-like as the strength of the prior increases.
The smoothed and filtered values show the Goodreads ratings to be worse (less informative) than we initially feared. Fully 80% of adjusted ratings are between 3.5 and 4.2, a range considerably less than the one star’s worth of discrimination available to individual users when rating a book. Virtually every book on the platform that has enough ratings to be reliable gets at least a 3, and virtually none gets more than a 4.5.
A partial solution
Given that we have a model of the data, we can adjust the average rating of books with too few ratings to give ourselves a more accurate estimate of the true average of the book. Furthermore, we can use the model to determine what percentile a given rating corresponds to: my analysis suggests that a book with a Bayesian rating of 4 is better rated than 2/3 of books on Goodreads.
For those who are interested in more accurate ratings (for books with a small number of them) and the ability to see a book’s percentile, I have made a user script which does just that!
Does the ability to see rankings instead of a raw score solve the problem with Goodreads? It certainly makes things better, but in my opinion it doesn’t solve the basic problem, which is that Goodread ratings just kinda suck. They’re inconsistent, prone to audience biases, and fairly arbitrary.
A sampling:
- The Great Gatsby: 55%
- Romeo and Juliet: 27%
- Anna Karenina: 76%
- Deaf Republic: 99%
- Moby Dick: 7%
- Pride and Prejudice: 95%
- Milkman: 8%
- The Crucible: 11%
- The Adventures of Huckleberry Finn: 37%
As it happens, I think all of these works are great. (Books I hated are similarly all over the place.) The problem is not just that the ratings are so widely varied, it’s that there’s no apparent rhyme or reason to the order these books are in. When a film I think is great has a relatively low rating on IMDb (example: I’m Thinking of Ending Things), there is usually an obvious, comprehensible reason why most people didn’t like (or were indifferent to) the film. Likewise, I thought Star Trek Into Darkness was quite bad, but I understand why most people liked it. Nothing of the sort can be said for Goodreads: not many people dislike Shakespeare — so what’s happening here? Unlike with IMDb, where the ratings (though clearly inflated, with most movies between a six and an eight) do frequently indicate something about the quality of the movie, I’ve found no way to extract the same value from ratings on Goodreads.
-
Here, I’m eliding how we arrive at the precise
αandβvalues: the Dirichlet is parametized by a vectorαthat behaves exactly the same way as theαandβvalues of the beta distribution. Since our data has 5 possibilities,αwill contain 5 values. To update a Dirichlet prior, each of the values is added to the corresponding value in the evidence vector. As Masurel shows, since we care only about the average value we can simplify the resultingαvector down to two variables; the sum of the vector, and the average (number of stars) that a book with exactlyαreviews would have. These values are just thecandmof the bayesian average approach. ↩